Skip to content
alkemist

Test page

Models, charts, equations, code, and everyday interface elements. Try each example, inspect its source, and switch boards to compare styles.

3D model

3D model · glTF 2.0

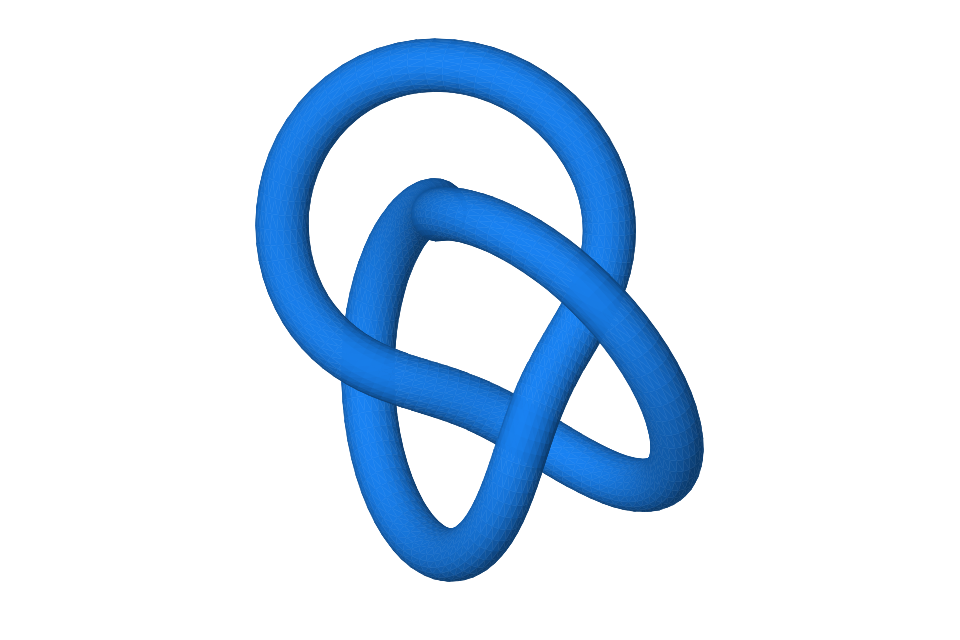
Torus knot

A (2, 3) torus knot. Drag to orbit, scroll to zoom, or use the camera buttons. The shape is a real, downloadable GLB.

Static view of Torus knot

Drag to orbit · scroll to zoom

Model source
example.astroastro
---
import AlkModel from '@alkemist/ui/AlkModel.astro';
---

<AlkModel
  src="/test/torus-knot.glb"
  poster="/test/torus-knot.svg"
  title="Torus knot"
  description="A (2, 3) torus knot. Drag to orbit or use the camera buttons."
/>

Palette

The exact same colors on #eee and #111. Switch the board in the header; the ink never changes.

Whiteboard / #eeeeee
Cobalt#1982f2
Cyan#158eab
Teal#199287
Fern#029828
Ochre#a67c01
Vermilion#e25312
Rose#e24a7a
Violet#a464e3
Blackboard / #111111
Cobalt#1982f2
Cyan#158eab
Teal#199287
Fern#029828
Ochre#a67c01
Vermilion#e25312
Rose#e24a7a
Violet#a464e3

Keep the color. Change the surface.

Download palette JSON ↗

Colored marks and large handwritten notes contrast against both boards. Small text stays neutral. Read the palette rules →

Math

Inline notation, display equations, matrices, and aligned derivations. Math is typeset at build time.

eiπ+1=0e^{i\pi} + 1 = 0
Euler’s identity

Fourier transform

f^(ξ)=f(x)e2πixξdx\widehat{f}(\xi) = \int_{-\infty}^{\infty} f(x)\,e^{-2\pi i x\xi}\,dx
The Fourier transform

Move from position to frequency. A new view can reveal a simpler structure.

Damped oscillator

ddt[xv]=[01ω22ζω][xv]\frac{d}{dt}\begin{bmatrix}x\\v\end{bmatrix}=\begin{bmatrix}0&1\\-\omega^2&-2\zeta\omega\end{bmatrix}\begin{bmatrix}x\\v\end{bmatrix}
A damped harmonic oscillator

Position and velocity evolve together. The chart below follows a synthetic damped signal.

Proposition

Conservation of energy

For an undamped oscillator with unit mass, x¨=ω2x\ddot{x}=-\omega^2x, total energy is constant.

E=12x˙2+12ω2x2dEdt=x˙(x¨+ω2x)=0.\begin{aligned}E &= \tfrac12\dot{x}^{\,2}+\tfrac12\omega^2 x^2\\[4pt]\frac{dE}{dt}&=\dot{x}(\ddot{x}+\omega^2x)=0.\end{aligned}
Proof by differentiation
Equation source
example.astroastro
---
import AlkMath from '@alkemist/ui/AlkMath.astro';
---

<AlkMath tex={String.raw`e^{i\pi} + 1 = 0`} label="Euler’s identity" />

Charts

Hover for values. Zoom into a signal. Open the data table. Every chart below reads a local CSV, with grid lines on by default.

Synthetic dataset · line

Damped oscillation

Synthetic oscillator: ω₀ = 2 rad/s, ζ = 0.12; x(0) = 1 m, v(0) = 0.

CSV
Shift + scroll to zoom · drag to pan
Data table

The table loads alongside the chart.

Line chart source
example.astroastro
---
import AlkChart from '@alkemist/ui/AlkChart.astro';
---

<AlkChart
  src="/test/oscillation.csv"
  type="line"
  x="time"
  y="position"
  title="Damped oscillation"
  description="Synthetic oscillator: ω₀ = 2 rad/s, ζ = 0.12; x(0) = 1 m, v(0) = 0."
  xLabel="Time (s)"
  yLabel="Position (m)"
  height={340}
  sample
/>

Shift + scroll to zoom. ↗

Synthetic dataset · bar

Bar chart

Invented component counts, with a stable ink for each category.

CSV
Data table

The table loads alongside the chart.

Bar chart source
example.astroastro
---
import AlkChart from '@alkemist/ui/AlkChart.astro';
---

<AlkChart
  src="/test/materials.csv"
  type="bar"
  x="material"
  y="value"
  color="material"
  title="Bar chart"
  description="Invented component counts, with a stable ink for each category."
  xLabel="Component"
  yLabel="Count"
  height={280}
  sample
/>

Synthetic dataset · donut

Donut chart

The same counts as shares. Labels and a table keep color from carrying the explanation alone.

CSV
Data table

The table loads alongside the chart.

Donut chart source
example.astroastro
---
import AlkChart from '@alkemist/ui/AlkChart.astro';
---

<AlkChart
  src="/test/materials.csv"
  type="donut"
  x="material"
  y="value"
  color="material"
  title="Donut chart"
  description="The same counts as shares. Labels and a table keep color from carrying the explanation alone."
  yLabel="Count"
  height={280}
  sample
/>

Synthetic dataset · scatter

Phase portrait

The signal and its analytic derivative spiral toward rest.

CSV
Shift + scroll to zoom · drag to pan
Data table

The table loads alongside the chart.

Scatter chart source
example.astroastro
---
import AlkChart from '@alkemist/ui/AlkChart.astro';
---

<AlkChart
  src="/test/oscillation.csv"
  type="scatter"
  x="position"
  y="velocity"
  title="Phase portrait"
  description="The signal and its analytic derivative spiral toward rest."
  xLabel="Position (m)"
  yLabel="Velocity (m/s)"
  ink="rose"
  height={280}
  sample
/>

Synthetic dataset · heatmap

Heatmap

625 synthetic samples of cos(1.4x) sin(1.4y) exp(−(x² + y²)/8). A continuous cobalt scale shows ordered values.

CSV
Data table

The table loads alongside the chart.

Heatmap chart source
example.astroastro
---
import AlkChart from '@alkemist/ui/AlkChart.astro';
---

<AlkChart
  src="/test/field.csv"
  type="heatmap"
  x="x"
  y="y"
  value="value"
  valueLabel="Field value"
  title="Heatmap"
  description="625 synthetic samples of cos(1.4x) sin(1.4y) exp(−(x² + y²)/8). A continuous cobalt scale shows ordered values."
  xLabel="x (dimensionless)"
  yLabel="y (dimensionless)"
  height={280}
  sample
/>

Synthetic dataset · pie

Pie chart

The same eight component counts as a pie, for comparing the pie and donut treatments.

CSV
Data table

The table loads alongside the chart.

Pie chart source
example.astroastro
---
import AlkChart from '@alkemist/ui/AlkChart.astro';
---

<AlkChart
  src="/test/materials.csv"
  type="pie"
  x="material"
  y="value"
  color="material"
  colorLabel="Component"
  title="Pie chart"
  description="The same eight component counts as a pie, for comparing the pie and donut treatments."
  yLabel="Count"
  height={300}
  sample
/>

Code

Four languages in Ubuntu Mono, with line numbers, highlighted lines, and a copy button. The code surface stays dark on both boards.

integrate.tstypescript
type State = { position: number; velocity: number };

// Semi-implicit Euler: velocity first, then position.
export function step(s: State, dt: number, k = 1): State {
  const velocity = s.velocity - k * s.position * dt;
  return { velocity, position: s.position + velocity * dt };
}

Use the arrow keys to move between languages. The full source copies without line numbers.

Code component source
example.astroastro
---
import AlkCode from '@alkemist/ui/AlkCode.astro';

const code = `type State = { position: number; velocity: number };

// Semi-implicit Euler: velocity first, then position.
export function step(s: State, dt: number, k = 1): State {
  const velocity = s.velocity - k * s.position * dt;
  return { velocity, position: s.position + velocity * dt };
}`;
---

<AlkCode
  code={code}
  lang="typescript"
  title="integrate.ts"
  highlightLines={[4, 5]}
/>

Shaders, diagrams, and images

A live interference shader, an accessible SVG diagram, and an image with a caption and downloadable source.

Shader · two wave sources

Two-source interference

GLSL
Shader source
example.astroastro
---
import AlkShader from '@alkemist/ui/AlkShader.astro';
---

<AlkShader title="Two-source interference" frequency={9} angle={24} />
One idea, many representationsAn idea connects to a mathematical model, code, a dataset and a visualization, which loops back to a new question.an ideaa modelsome codea dataseta new view…and another question
Drawing the loop · accessible SVG, selectable text, the shared inks.
An illustrated torus knot rendered as a flowing loop with violet and cobalt strokes on a black board.
The model also has a static SVG poster. An image remains useful before the interactive viewer loads.

Image and caption

This SVG is the model viewer’s static poster. It remains available before the 3D renderer loads.

Download the actual model ↗

Writing

This section is authored in MDX. Tables, footnotes, task lists, quotations, inline math, and semantic HTML share the same theme.

A notebook is more than a paragraph.

Good research leaves a trail: an observation, a question, a source, and enough detail to try it again. Write position += velocity * dt, add an equation like E=mc2E = mc^2, and keep the explanation beside the experiment.

The most useful figure is the one you can ask another question of.

— A working principle for this workbench

A small experiment

  1. Choose an initial condition.
  2. Change one parameter at a time.
  3. Record the result, including the surprise.
  • Keep units in the axis labels.
  • Make source data downloadable.
  • Repeat with a different initial condition.
QuantitySymbolUnitExample
Positionxxmetre0.42
Velocityvvmetre / second−0.18
EnergyEEjoule2.70

The oscillator here is synthetic, not a measurement.1

Small details matter, too

Water is H2O. A square metre is m2. GPU work should be optional. A surprising result deserves a second look. Correct a claim with always stable stable under the stated step-size bound.

Use Tab to move between controls. No special pointing device required.

What does “synthetic” mean here?

The values come from a deterministic formula. They test presentation and interaction; they are not evidence about a physical system.

Footnotes

  1. The CSV fixtures are generated from version-controlled scripts and shipped alongside each chart.

Forms and controls

Inputs, a select menu, checkboxes, a range, validation, and a dialog. Changes update the preview in this browser.

Include in the notebook
Local specimen

Untitled experiment

Mathematics · 65% confidence

Add a working note and preview the card.

Source data · Handwritten annotations

The preview stays in this browser. Nothing is submitted to a server.

Why include ordinary form elements?

A theme is only useful when the quiet details work too: a long label, a selected option, a keyboard focus ring, a helpful result.

A disabled state

Specimen details

Dialogs have a title, a clear way out, and keyboard focus. Press Esc or close below.

Use an example

Open its source above, copy the snippet, and replace the demo content.